Your climate tech website is probably generating more emissions than you've ever calculated, and it may also be slowing down the conversations you're trying to have with investors and partners.
Every page your users load, every image your server transfers, every JavaScript bundle a browser has to parse burns energy. The median mobile webpage now weighs 2.6 MB according to the HTTP Archive, a 202.8% increase since 2015. If you're running any meaningful traffic, that adds up to a measurable footprint most teams have never audited.
There's a performance problem nested inside that operational one. Heavier pages load slower, and slower pages cost you conversions, search rankings, and credibility with the exact investors and partners you're trying to reach. Research from Akamai found that a 100ms delay in load time reduces conversion rates by roughly 7%.
This guide walks you through how to measure your website's actual carbon footprint, which optimizations deliver the highest impact for the least effort, and a five-phase framework to reduce emissions by 30-80% without rebuilding from scratch.
TLDR: key takeaways
- The internet accounts for approximately 4% of global CO2 emissions, more than aviation's 2.5% share (per The Shift Project)
- Switching to green hosting can cut operational carbon by 50-100% without touching a line of code
- Modern image formats like WebP and AVIF reduce file sizes by 25-50% without quality loss
- Page speed directly impacts conversions: every 100ms delay reduces conversion rates by roughly 7% (Akamai)
- Most unoptimized sites can achieve 30-80% carbon reductions through the strategies in this guide
Understanding low-carbon web design
Low-carbon web design is the practice of creating digital experiences that minimize energy consumption and carbon emissions throughout the user journey.
It addresses three primary emission sources: data storage (hosting servers running 24/7), data transfer (moving content from servers to users), and processing power (rendering pages on user devices).
For you specifically, this carries a layer of credibility stakes that most industries don't face. If your technology claims to reduce environmental impact, a bloated, energy-inefficient website sends a contradictory signal to the investors, partners, and enterprise buyers you're trying to win over. The alignment between your product's mission and your digital presence is part of your positioning, whether you're actively communicating it or not.
According to the Sustainable Web Design Model (SWDM) v4, energy consumption breaks down across the digital ecosystem as follows: user devices account for 54% of total system energy, networks 24%, and data centers 22%.
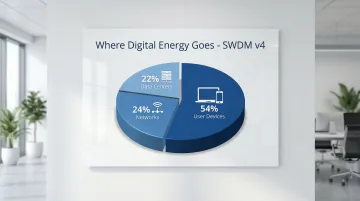
These numbers reveal where optimization efforts deliver the greatest impact. User devices account for more than half of total system energy, which means every kilobyte you don't send is energy your users don't have to spend processing it. Sustainable web design is about efficiency. You can maintain visual quality and full functionality while transferring significantly less data.
The core principle is efficiency: delivering the same quality experience with fewer resources, building sites that load faster across devices, and reducing operational costs while shrinking your environmental footprint. Because user devices account for more than half of total system energy, every kilobyte you eliminate pays dividends on both sides of the equation.
The environmental impact of websites
Every website carries an operational cost that most teams never calculate. The IEA estimates that data centers and transmission networks consumed around 460 TWh in 2022, with workloads growing 340% between 2015 and 2022. That energy has to come from somewhere, and until your hosting runs entirely on renewables, a portion of it generates carbon.
The weight of the average webpage has compounded this problem significantly. The HTTP Archive shows the median mobile page now sits at 2.6 MB, up 202.8% since 2015. Streaming one hour of video consumes vastly more data than browsing static pages, and every page view requires energy to transmit across networks, process on servers, and render on devices.
The energy chain runs from data centers through network infrastructure (cables, routers, cell towers) to end-user devices, with each segment consuming electricity that generates carbon unless powered by renewables.
For your climate company, this matters at two levels. First, operationally: page weight directly affects load speed, which directly affects whether users stay, convert, and return. Second, reputationally: if your technology exists to reduce environmental impact, your website's footprint is part of your story, even when you're not explicitly telling it.
Measuring your website's carbon footprint
Calculating emissions
The Website Carbon Calculator provides instant estimates of CO2 per page view based on data transfer volume, energy sources, and traffic patterns.
It uses the industry-standard Sustainable Web Design Model v4, which calculates emissions using this formula:
Energy intensity (kWh/GB) = Energy consumption (kWh) / Data transfer (GB)
Four factors determine your carbon footprint: page weight (heavier pages require more energy to transfer), hosting energy source (renewable-powered servers dramatically reduce operational emissions), traffic volume (more visitors multiply the impact), and user location (greater distance between server and user increases network energy consumption).
Once you understand these factors, start by measuring your highest-traffic pages. These represent both your biggest environmental impact and your greatest optimization opportunity. They're also the pages enterprise buyers and investors are most likely to land on — so performance improvements here pay off commercially as well as environmentally.

Performance benchmarks
Three tools help you assess current performance and identify optimization opportunities. Google Lighthouse audits performance, identifies unused code, and flags unoptimized images. WebPageTest provides detailed metrics including a "Carbon Control" feature powered by CO2.js. GTmetrix analyzes page speed and provides actionable optimization recommendations.
Target these benchmarks for low-carbon performance: page weight under 1 MB, load time under 3 seconds, minimal HTTP requests (fewer server round-trips), and Core Web Vitals in the "Good" range. That last metric also feeds directly into Google's search ranking algorithm, which affects whether buyers searching for solutions like yours find your site at all.
Set reduction goals
Significant reductions are achievable with focused effort. Jisc, the UK's national research and education network, reduced emissions by 72% on key pages, dropping from 1.09g to 0.30g of CO2 per visit, through a structured redesign and optimization process.
Your site can realistically achieve 30-80% reductions depending on starting point and how aggressively each phase is pursued.
Track progress with quarterly audits using the same measurement tools each time. Document your baseline, set specific percentage targets, and monitor improvements over time. This data also becomes useful for stakeholder reporting, particularly for investors and partners who ask about operational sustainability.
Core principles of low-carbon web design
Green hosting and infrastructure
Of all the changes covered in this guide, hosting is the one that moves the needle most immediately. Switching to renewable-powered data centers can reduce your site's operational carbon by 50-100% according to research cited in the Sustainable Web Design Model, without touching a single line of code.
For you specifically, there's a signal clarity argument too. If you're pitching carbon reduction technology to enterprise buyers or institutional investors, running your own website on fossil-fuel-powered servers is the kind of inconsistency that surfaces in due diligence conversations.
When choosing a provider, verify claims through The Green Web Foundation's directory rather than relying on provider marketing. Check for transparency in sustainability reporting, confirm the actual energy sources (wind, solar, hydro), and look for server locations near your primary audience to reduce data travel distance.
Leading cloud providers like Google achieve Power Usage Effectiveness (PUE) ratings of 1.1, compared to the industry average of around 1.5. Research from Accenture and WSP found that shifting from on-premise to cloud infrastructure can reduce carbon emissions by up to 84%.
Content delivery networks (CDNs) complete the infrastructure picture. They serve files from locations geographically closer to users, cutting data travel distance and the associated network energy consumption.
Efficient content strategy
Every page on your site consumes energy with each server request, which means low-value content that nobody reads is actively costing you. Content auditing removes this unnecessary weight by identifying what actually serves users versus what just adds load time.
Apply digital minimalism: every page should serve a clear user need or business goal. Archive or delete outdated and low-performing content, consolidate pages that cover overlapping topics, and prioritize high-value, frequently accessed content over completeness for its own sake.
Analytics reveal pages with low traffic or high bounce rates. These waste energy without delivering value, and they dilute the signal clarity of your site for visitors who are trying to understand what you do.
Consider a climate SaaS team that cut their site from 40 pages to 22, removing everything that wasn't driving conversions or organic search traffic. Their mean load time dropped by roughly 20% and the path from homepage to demo request shortened to three clicks — not through a redesign, but by eliminating the pages that were adding noise without adding value.
Image and media optimization
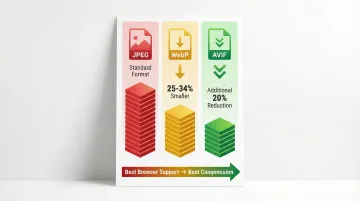
Images typically account for the largest portion of page weight. Modern formats offer meaningful improvements over JPEG without sacrificing visual quality:
- WebP: 25-34% smaller than JPEG at equivalent quality (per Google Developers)
- AVIF: an additional 20% reduction over WebP in most cases
- Strategy: serve AVIF to modern browsers, fall back to WebP, use JPEG only as a last resort
For compression, ImageOptim works well on Mac, TinyPNG is a web-based option available cross-platform, and most image editing software includes built-in compression that gets the job done for smaller batches.
Video is significantly more energy-intensive than static images. Before keeping any video, ask whether the content works without it. If it stays, compress aggressively, use appropriate resolution (HD is sufficient for most use cases where 4K is overkill), and replace autoplay with thumbnail images that require a click to play.
For a buyer arriving at your site ahead of a first call, a page that loads in under 2 seconds creates a meaningfully different first impression than one that takes 4. That difference registers before you've had a chance to make your case.
Sustainable design patterns
Design choices directly affect how much data gets transferred on every page load:
Typography choices
System fonts (already installed on user devices) eliminate the need to download custom font files, which can exceed 200 KB. If custom fonts are essential to your brand, use WOFF2 format, which offers 30% better compression than WOFF according to Google Fonts documentation, and subset fonts to include only the characters you actually use, reducing file sizes by up to 94%.
On a site visited by procurement teams assessing your company, consistently fast page rendering is a small but real signal that your team builds things with care.
Visual and layout optimization
Three design decisions reduce energy per page view. Offering a dark mode option matters on OLED screens — common in modern smartphones — where it reduces display power consumption by up to 7.8% according to research from Purdue University. Minimalist layouts help users find what they need faster, cutting unnecessary page loads that serve no purpose. And choosing static over dynamic page generation delivers significant efficiency gains: benchmark data shows static sites serving 2,218 requests per second versus 6.16 requests per second for dynamic WordPress pages.
Each of these choices also means your site holds up cleanly during the traffic spike that follows a press mention, a conference appearance, or a warm investor introduction — moments when your site's performance is most visible.
Clean, efficient code
Minification removes unnecessary characters from code without changing functionality. According to the HTTP Archive's Web Almanac, the 90th percentile of websites could save 41 KB of JavaScript through minification alone, which translates directly to faster load times and lower transfer energy.
Tree-shaking eliminates unused code during the build process. You might be loading entire JavaScript libraries when your site only uses a fraction of the available functions, which means every user pays the download cost for code that never executes.
Modern build tools like Vite, Rollup, and esbuild automate both of these optimizations, making efficient code easier to maintain without manual overhead. For technical stakeholders evaluating your company, a fast, lean site is a quiet signal that your team builds things well.
Caching and performance
Browser caching stores static assets (images, CSS, JavaScript) locally on user devices, eliminating repeated downloads for returning visitors and reducing both data transfer and server load in the process.
Server-side caching stores pre-generated page versions, reducing the processing power needed to serve each request. Together, these two caching strategies tend to deliver some of the most immediate performance and sustainability gains available without a full redesign.
In a typical enterprise evaluation cycle, a buyer might visit your site four or five times — during initial research, after a demo, before a procurement review. Caching ensures each return visit loads in milliseconds rather than rebuilding from scratch, keeping the experience consistent across every touchpoint in a drawn-out sales process.
Implementation: step-by-step guide to building a low-carbon website
This five-phase framework takes you from initial audit through ongoing optimization. Each phase builds on the last, creating a systematic approach to sustainable web design that doesn't require starting from scratch.
Phase 1: audit and baseline
Conduct a content audit: Use analytics to identify high-traffic pages, document current page weights and load times, and flag underperforming content for removal or consolidation. Prioritize your optimization effort based on where the traffic actually goes.
Measure carbon footprint: Run your top 10 pages through the Website Carbon Calculator, document baseline metrics, and calculate total estimated annual emissions based on traffic volume.
Once you understand your starting point, you can make informed decisions about where to direct infrastructure and optimization effort. The baseline metrics you establish here are also a credible, specific answer when investors or sustainability-focused procurement teams ask about your operational carbon footprint.
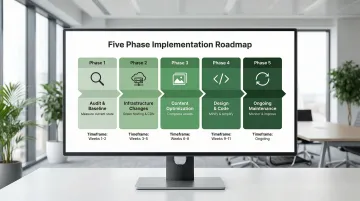
Phase 2: infrastructure changes
Migrate to green hosting: Research providers verified by The Green Web Foundation, plan your migration timeline and backup procedures, test thoroughly before switching DNS, and monitor performance post-migration.
Implement or optimize CDN: Select a CDN with global coverage matching your audience geography, configure caching rules for static assets, and test delivery speeds from different geographic locations before going live.
With sustainable infrastructure in place, turn your attention to the content consuming the most bandwidth.
Phase 3: content and asset optimization
Images: Compress all images using tools like ImageOptim or TinyPNG, convert to WebP or AVIF formats, and resize to actual display dimensions — don't serve 2000px images in a 500px container. Implement lazy loading for below-the-fold images so they only load when users scroll to them.
Videos: Before keeping any video, ask whether the content works without it. If it stays, compress remaining videos aggressively, use appropriate resolution (HD suffices for most use cases where 4K is overkill), and consider thumbnail images with click-to-play instead of autoplay.
Content: Remove or archive outdated pages, consolidate similar content, and ensure every remaining page serves a clear purpose.
Phase 4: design and code improvements
Code optimization: Minify CSS, JavaScript, and HTML; remove unused CSS and JavaScript libraries; and eliminate unused code during your build process (tree-shaking).
Font strategy: Switch to system fonts where brand guidelines allow. If custom fonts are essential, use WOFF2 format and include only needed characters (subsetting). Limit font weights and styles to only what the design actually requires.
Design simplification: Review decorative elements critically — ask whether each one adds value for the user, not just visual interest. Simplify navigation to reduce clicks to key content, and consider static page generation for content that doesn't change frequently.
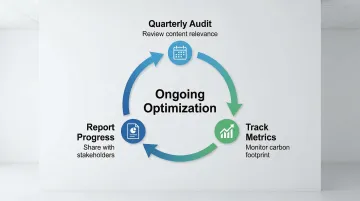
Phase 5: ongoing maintenance
Establish audit schedule: Run quarterly reviews of content relevance, track performance metrics, and measure carbon footprint against your baseline each cycle.
Create content guidelines: Document image optimization requirements, set maximum file size limits, and establish an approval process for video content before it goes live.
Monitor and report: Track carbon reduction progress, share results with stakeholders, and identify new optimization opportunities as traffic patterns shift.
Tools and resources for sustainable web design
Building a low-carbon website requires the right measurement tools, optimization resources, and a process for keeping both in check over time. This toolkit covers the essentials.
Measurement and analysis:
Start by understanding your current footprint. These tools quantify emissions and surface optimization opportunities:
- Website Carbon Calculator - estimates CO2 emissions per page view and compares your site against industry averages
- CO2.js - open-source JavaScript library for integrating real-time carbon estimation into your analytics
- Google Lighthouse - automated performance audits with specific optimization recommendations
- WebPageTest - detailed performance metrics including the Carbon Control feature for emissions tracking
Optimization tools:
Once you've identified the issues, these tools help reduce file sizes and verify hosting choices. ImageOptim and TinyPNG compress images without visible quality loss, typically reducing file sizes by 50-70%. Green Web Check verifies whether your hosting provider uses renewable energy.
Educational resources:
Sustainable web design standards evolve alongside the tools. These are the most reliable references. "Sustainable Web Design" by Tom Greenwood covers principles, case studies, and implementation strategies in depth. The Web Sustainability Guidelines (WSG) from W3C provide evidence-backed standards for sustainable digital design. ClimateAction.tech is a community of tech professionals sharing practices in climate-focused organizations.
Start with measurement tools to establish your baseline, then use optimization resources to reduce your footprint systematically. If you're unsure where to begin or how to interpret what the tools surface, a structured audit is often the most efficient first step.
The measurement outputs from these tools also translate directly into sustainability documentation you can share in due diligence packs, investor updates, or enterprise procurement submissions.
At What if Design, we work with climate tech companies to make sure the websites we build meet both performance and sustainability benchmarks from the start, so you're not retrofitting these decisions later.
A note on what this achieves
Most unoptimized climate tech websites can achieve 30-80% carbon reductions through the strategies covered in this guide. The framework isn't complicated, but it does require prioritization. Start with the highest-traffic pages, address hosting first since it delivers the largest immediate reduction, then work through images, code, and content systematically.
Your website should reflect the operational standards your technology holds itself to. If there's a gap between the two, that's worth closing, both for what it signals externally and for what it costs you internally.
Frequently asked questions
How to make a website carbon neutral?
Start by reducing emissions through green hosting, efficient design, and compressed assets. Measure remaining emissions with tools like the Website Carbon Calculator, then offset unavoidable emissions through verified carbon programs. Prioritize reduction over offsetting, since offsetting a heavy, slow website doesn't address the underlying performance problem.
What is the 3 second rule in website design?
Research from Google and Deloitte found that 53% of mobile visitors abandon pages that take longer than 3 seconds to load. Faster-loading sites reduce bounce rates while naturally lowering carbon footprints through reduced data transfer and more efficient code. The two outcomes reinforce each other.
Does low-carbon web design mean sacrificing visual appeal?
No. Visually strong, engaging websites can maintain low carbon footprints through modern image formats, efficient code, and thoughtful asset management. Sustainable design prioritizes intentionality: every element serves a purpose and is delivered as efficiently as possible.
How much can I realistically reduce my website's carbon footprint?
Most websites can achieve 30-80% reductions depending on starting point and optimization effort. Jisc achieved a 72% reduction through redesign alone, dropping from 1.09g to 0.30g of CO2 per visit. Image optimization alone often yields 25-50% savings. Switching to green hosting can cut operational carbon by 50-100% without changing anything else about the site.
What's the business case for low-carbon web design beyond environmental benefits?
Low-carbon design delivers three concrete business outcomes: faster sites improve SEO rankings and user experience, which leads to higher conversion rates (a 100ms delay drops conversions by 7% per Akamai research); reduced hosting and bandwidth costs from smaller files; and stronger positioning among investors and enterprise buyers who evaluate ESG criteria as part of their procurement and investment decisions.
How do I choose a green web hosting provider?
Verify renewable energy claims through The Green Web Foundation's directory rather than relying on a provider's own marketing. Check for transparency in sustainability reporting and public documentation of energy sources. Consider server location relative to your primary audience to minimize data travel distance, and compare pricing and technical requirements alongside environmental credentials.